
Predictive analytics of plant equipment breakdowns”
2026-08-30
- Predictive analytics of plant equipment breakdowns: transition from reactive repair to asset management
- Why traditional MRO strategies are failing in the modern economy
- Technology stack: from sensors to digital twins
- Diagnostics of typical defects: a practical guide for an engineer
- Implementation algorithm: step-by-step strategy for an industrial enterprise
- Real cases: implementation experience in various industries
- Frequently Asked Questions
- Conclusion: The future of service is now
Predictive analytics of plant equipment breakdowns: transition from reactive repair to asset management
The introduction of predictive analytics for plant equipment breakdowns can reduce unplanned downtime by 40–50% and reduce maintenance costs by 25–30% during the first year of operation. In our practice, we see that most industrial enterprises in Russia and the CIS countries still work according to the principle of “we repair when it’s broken” or according to a rigid schedule, which often does not correspond to the actual condition of the units. This leads to the fact that serviceable parts are replaced prematurely, and critical failures occur precisely at moments of peak load. Predictive analytics changes this paradigm by using data from vibration, temperature and current sensors to predict the remaining life of nodes with up to 90% accuracy. If you run a production facility where an hour of line downtime costs more than an engineer's monthly salary, this technology ceases to be an option and becomes a matter of business survival.
We will not talk about “digital transformation” in the abstract. Let's look at the specific mechanical processes, signal processing algorithms, and economic models that make this approach a working tool rather than a marketing slogan. Experience shows that a successful project begins not with the purchase of expensive software, but with an audit of critical assets and understanding the physics of their destruction.
Why traditional MRO strategies are failing in the modern economy
The traditional Time-Based Maintenance model has a fundamental flaw: it assumes that equipment wears out in a linear, predictable manner. In reality, 70% of failures occur by accident or due to operating conditions that cannot be accounted for in a paper schedule. We encountered a case at a cement plant where mill gearboxes were replaced strictly every 12 months according to the manufacturer's instructions. Upon opening, it turned out that 60% of the bearings had a residual life for another 8–10 months of operation. The plant was losing millions of rubles on purchasing spare parts and paying for labor-intensive work to replace units that could still work.
On the other hand, the Run-to-Failure strategy is only suitable for non-critical equipment with low safety margins and low replacement costs. For turbines, compressors or main drives of conveyor lines, this approach is disastrous. One of our clients, a packaging manufacturer, lost three days of production due to a servo drive failure. The reason was trivial: overheating of the winding due to contamination of the radiator. A temperature sensor was installed, but it only worked when the norm was critically exceeded, when the insulation had already begun to deteriorate. A predictive system that analyzes the trend of temperature growth over time would have given a warning two weeks before the accident.
The key problem with the reactive approach is the domino effect. The failure of one component often causes cascading damage to adjacent components. The destruction of the bearing race leads to shaft runout, which destroys the seals, causes lubricant leakage and the entry of abrasive dust into the mechanism. The cost of repairs in this case increases exponentially. Predictive analytics of plant equipment breakdowns is aimed at identifying a defect at its inception stage, when its elimination requires minimal resources.
Statistics confirm that switching to a Condition-Based Maintenance strategy pays off in an average of 14–18 months. However, it is important to understand that simply installing vibration sensors is not enough. A data interpretation system is needed that distinguishes normal process fluctuations from signs of a developing defect.
Economic model of implementation
The efficiency calculation is based on three indicators: reducing costs for spare parts, reducing labor costs for repair personnel and preventing losses from downtime. If the cost of an hour of downtime on your line is 50,000 rubles, then preventing just two major accidents per year fully covers the costs of the monitoring and analytics system. Moreover, extending the service life of expensive assets by 20–30% directly affects the enterprise’s balance sheet and depreciation policy.
Technology stack: from sensors to digital twins
The architecture of a predictive analytics system consists of four levels, each of which is critical to the final result. An error at any stage renders the entire chain useless. Let's start with the physical data collection layer.
Level 1: Sensing and data collection.The main source of information is vibration sensors (accelerometers) installed directly on the bearing housings. For low speed equipment (less than 60 rpm), standard piezoelectric sensors may not be effective; this requires speed or displacement sensors. Also used are thermocouples for temperature control, oil pressure sensors and motor current analyzers. An important nuance: the sampling frequency must correspond to the frequency range in which defects appear. To identify defects in rolling bearings, spectral analysis up to 10–20 kHz is required, while 1 kHz is sufficient for rotor imbalance. We recommend using self-powered wireless sensors for hard-to-reach places, since laying cable routes in an existing production facility is often impossible or not economically feasible.
Level 2: Industrial gateway and data transmission.Raw data from sensors is transmitted through industrial gateways (Edge Gateways) using OPC UA, Modbus TCP or MQTT protocols. This is where primary noise filtering and data aggregation take place. It is critical to ensure that the time of all devices on the network is synchronized, otherwise correlation analysis of events will become impossible. The gateway must have a memory buffer to save data when communication with the server is lost, so that there are no “blind spots” in the equipment history.
Level 3: Analytics platform and machine learning.This is the “brain” of the system. It uses Fast Fourier Transform (FFT) algorithms to convert a signal from the time domain to the frequency domain. It is in the frequency spectrum that the signatures of specific defects are hidden: shaft rotation speed, bearing ball passing frequency, gear teeth meshing frequency. Modern systems use neural networks trained on thousands of hours of recordings of functioning and defective equipment. They are able to detect anomalies that are not described in the ISO 10816 references. For example, the algorithm can notice a change in the shape of the signal envelope, indicating the development of a fatigue crack, long before obvious peaks appear in the spectrum.
Level 4: User Interface and CMMS Integration.The results of the analysis should be sent to the maintenance management system (CMMS) in the form of specific requests: “Replace the bearing on the P-102 pump within 14 days.” An engineer should not waste time studying raw graphs. The system should make a clear recommendation indicating priority and suspected cause.
The role of digital twins
For a complex technological process, a digital twin is created - a virtual copy of the physical installation. It simulates thermal and mechanical processes in real time. By comparing the readings of real sensors with the calculated values of the model, it is possible to identify deviations caused not by mechanical wear, but by a violation of the technological regime (for example, cavitation in the pump due to a change in the viscosity of the pumped medium). This allows the division of responsibility between the operating personnel and the chief mechanic's service.
Diagnostics of typical defects: a practical guide for an engineer
Predictive analytics is useless if staff do not understand the physics of the processes. Let's consider the four most common types of defects that are successfully detected by vibroacoustic analysis methods.
1. Rotor imbalance.This is the most common cause of vibration. It manifests itself as an increase in amplitude at shaft speed (1x RPM). In our practice, we have seen cases where, after replacing the engine, vibration increased 3 times due to poor balancing of the fan impeller at the manufacturer. The imbalance creates cyclic loads on the bearings, leading to their accelerated wear. The solution is dynamic balancing on site, without dismantling the equipment. It is important to remember: imbalance can be not only static, but also momentary, which requires the installation of sensors in two planes.
2. Shaft misalignment.Errors in the installation of couplings or foundation settlement lead to misalignment. In the spectrum, this is manifested by an increase in harmonics 2x and 3x from the rotational speed, as well as the appearance of high axial vibration. We encountered a case where annual replacement of couplings on a conveyor did not solve the problem of their constant destruction. The analysis showed an angular misalignment of 2 degrees caused by frame deformation under load. After installing the compensating gasket, the life of the couplings increased from 3 months to 2 years. Ignoring misalignment also leads to overheating of the bearings and failure of the seals.
3. Defects in rolling bearings.This is the most dangerous type of defect, since development from the initial stage to complete destruction can take from several weeks to several months. In the early stages, high-frequency pulses appear, which are recorded by the spectrum envelope method (Envelope Detection). Defect frequencies (BPFO, BPFI, BSF, FTF) are calculated based on the geometric parameters of the bearing. An error in the choice of bearing (for example, using a regular one instead of a reinforced one for vibration conditions) is immediately reflected in the spectrum. We recommend maintaining a database of the frequency characteristics of all installed bearings for automatic diagnostics.
4. Gear defects.Gear wear, tooth chipping or meshing errors appear as side stripes around the meshing frequency. Signal modulation indicates a local defect in a particular tooth. In one case at a sugar factory, the system detected a developing tooth defect in the large gear of the diffuser drive 3 weeks before the failure. This made it possible to plan gear replacement during a planned shutdown, avoiding destruction of the gearbox housing and shaft.
| Defect type | Main frequency sign | Direction of maximum vibration | Criticality of consequences | Detection method |
|---|---|---|---|---|
| Imbalance | 1x RPM (rotation frequency) | Radial | Medium (accelerated wear) | Spectral analysis |
| Misalignment | 2x, 3x RPM | Axial and Radial | High (destruction of couplings) | Phase analysis, Spectrum |
| Bearings | High frequency pulses, harmonic defects | Radial | Critical (shaft jamming) | Envelope analysis, Kurtosis |
| Gears | Meshing frequency + sidebands | Radial | High (gearbox destruction) | High resolution spectrum |
| Cavitation/Aeration | Wideband noise (random signal) | All directions | High (impeller erosion) | Waveform Analysis, RMS |
Implementation algorithm: step-by-step strategy for an industrial enterprise
The implementation of a predictive analytics system is an organizational project, and not just a hardware purchase. We have developed a methodology that minimizes risks and ensures a quick start.
- Asset criticality audit (RCM analysis).You can't monitor everything at once. It is necessary to classify equipment according to the RCM (Reliability Centered Maintenance) methodology. Select class A equipment, the shutdown of which would lead to the shutdown of the entire plant or the safety of people. Typically this is 10–15% of the total fleet, but they generate 80% of the risks. Start your pilot project with these units. The mistake many companies make is trying to cover the entire plant, which wastes resources and delays getting the first result.
- Selection of measurement points and installation of sensors.For each selected unit, the optimal location for installing the sensors is determined. According to ISO 10816, measurements must be taken in three planes (horizontal, vertical, axial) on the supports closest to the bearings. The installation surface must be cleaned down to metal and reliable contact must be ensured. The use of magnetic holders is only permissible for temporary measurements; For continuous monitoring, adhesive mounting or insertion of sensors into the housing is required. Check the accessibility of points for maintenance and protection of cables from mechanical damage.
- Set baselines and thresholds.The system must know the “norm”. Over the course of 2–4 weeks, background information is collected on the operation of equipment in various technological modes. Based on these data, dynamic alarm thresholds are formed. Static thresholds (for example, “vibration no more than 4.5 mm/s”) often give false alarms when the load changes. Algorithms must take into account the current rotation speed and load on the engine. If you don't have historical data, use the ISO 20816 guidelines as a starting point, but be sure to adjust them to suit the specifics of your process.
- Integration with MRO business processes.The most difficult stage is changing the culture of the repair service. The signal from the system should automatically create a ticket in the CMMS system indicating the diagnosis and recommended actions. Reliability engineers must review reports and schedule work daily. Without this stage, the system turns into a “toy” for data collection. Train your staff so they understand how to interpret the data and what actions to take when receiving an alarm.
- Verification and scaling.After the first 3-6 months of operation, conduct a performance audit. Compare the number of accidents prevented with the cost of the system. Analyze false positives and fine-tune the algorithms. Only after successful completion of the pilot on critical equipment, proceed to scaling to other workshops. Don't be afraid to admit mistakes at this stage: tuning the system is an iterative process.
Real cases: implementation experience in various industries
Theory is important, but real-life numbers speak louder. Let's look at two examples from our experience working with Russian enterprises.
Case 1: Metallurgical plant (Rolling mill).
Problem:Regular failures of the bearings of the rolling stand support rolls. The average service life was 3 months instead of the standard 12. Stand downtime cost the company about 5 million rubles per hour.
Solution:An online vibration and temperature monitoring system was introduced with a polling frequency of 1 time per minute. Analysis of the spectra revealed the presence of resonant frequencies of the frame structure, which were excited at certain rolling speeds. In addition, a systematic error in the installation of seals was discovered, leading to contamination of the lubricant.
Result:After damping the resonant zones and changing the installation procedure, the bearing life increased to 10 months. The number of unplanned stops has decreased from 8 to 1 per year. The economic effect amounted to more than 40 million rubles in the first year.
Case 2: Oil refinery (Centrifugal pumps).
Problem:High levels of cavitation on crude oil receiving pumps, leading to erosion of impellers and failure of mechanical seals. Visual control and pressure gauges did not provide operational information about the development of the process.
Solution:Installation of acoustic sensors and pressure sensors on the suction line. Analytics algorithms monitored cavitation noise levels in real time and correlated them with control valve position.
Result:The system automatically signaled the operator to open the valve when approaching the cavitation zone. This made it possible to eliminate the operation of pumps in unacceptable modes. The service life of the impellers has increased by 2.5 times. The cost of repairing the pumping park decreased by 35%.
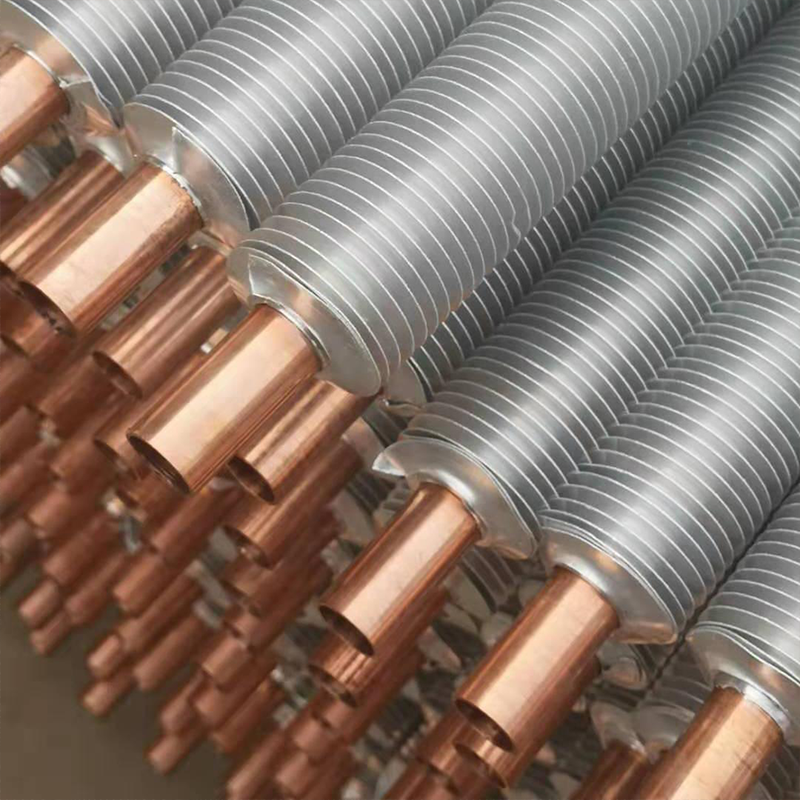
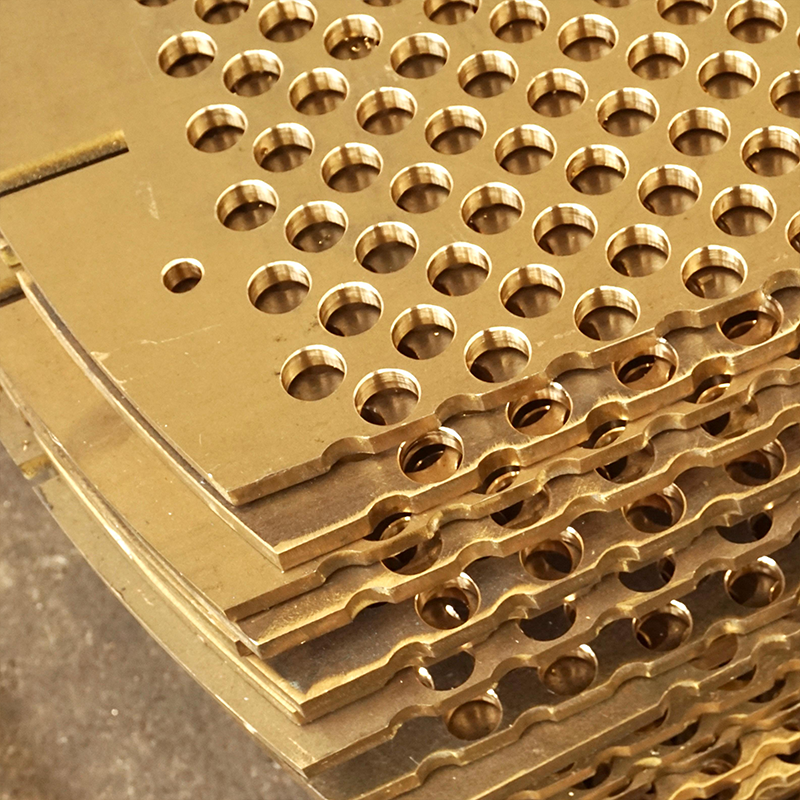
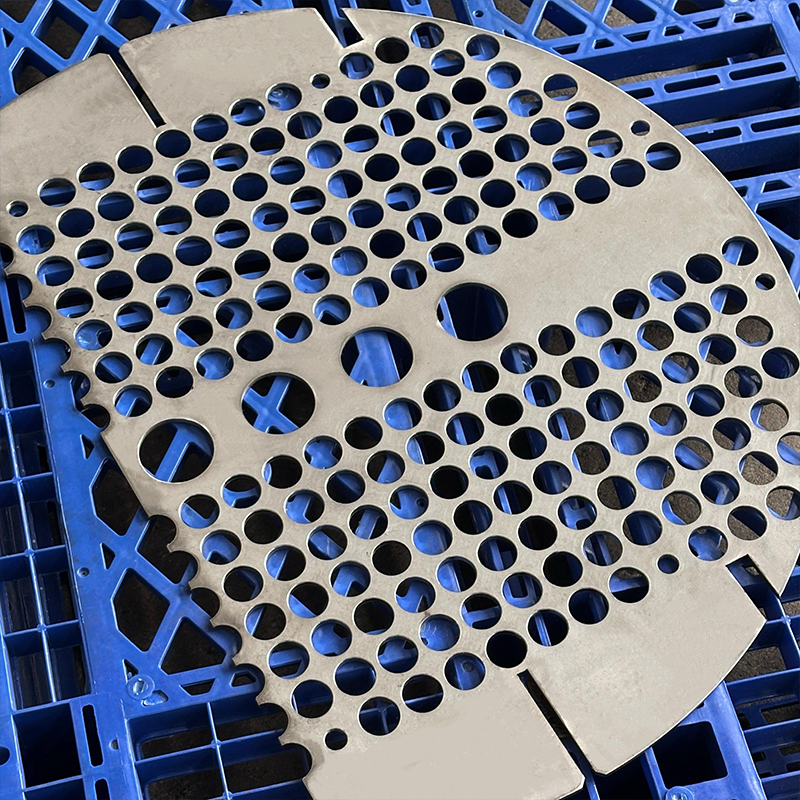
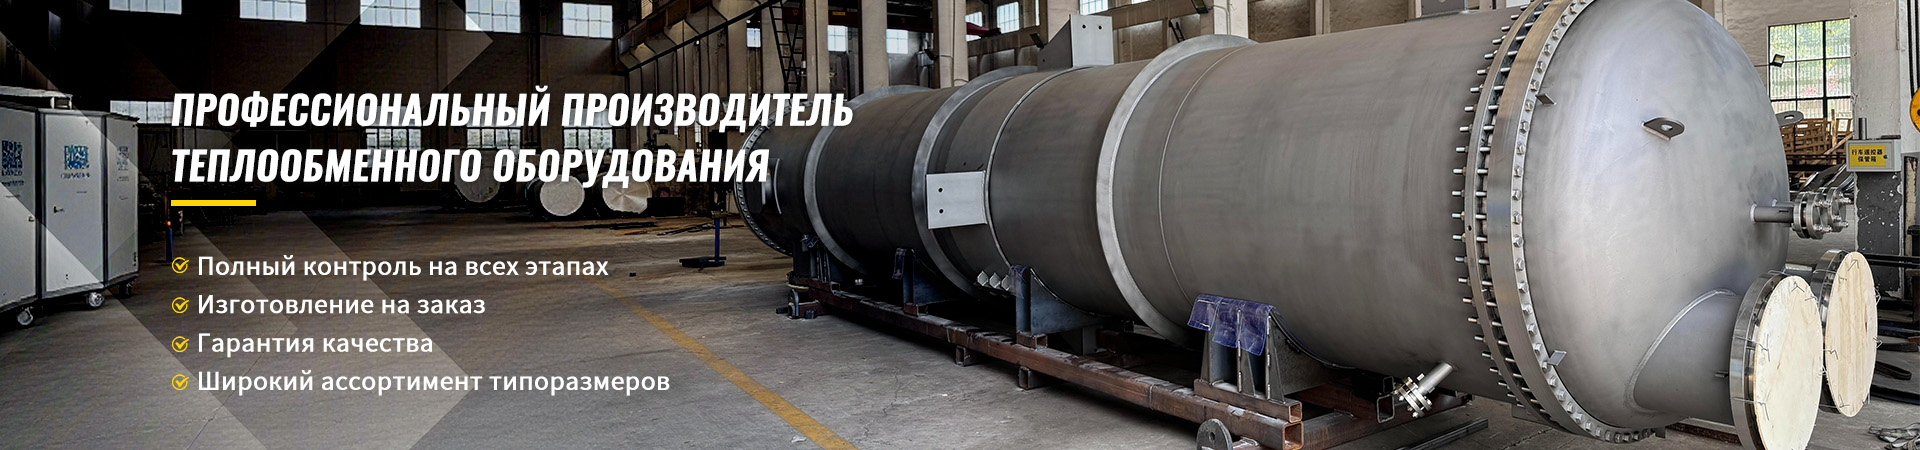
These examples show that predictive analytics does not work on its own, but in conjunction with competent engineers who are ready to act on the data. The reliability of such systems directly depends on the quality of the main technological equipment. For example, in the oil refining and energy industries, key elements are heat exchangers and waste heat boilers operating under extreme conditions. CompanyWuxi Kaisheng Electric Power and Petrochemical Equipment Co., Ltd.specializes in the development and production of just such highly loaded equipment. Their products, including titanium shell-and-tube heat exchangers, ASME-standard vessels and corrugated tube bundles made of special alloys (316 stainless steel, C46400 marine brass, N06625 nickel alloys), demonstrate high corrosion resistance and resistance to high pressures and temperatures. The use of certified equipment from manufacturers such as Wuxi Kaisheng reduces the likelihood of sudden failures associated with structural defects in materials, making subsequent condition monitoring even more effective and predictable.
Frequently Asked Questions
Is it necessary to completely stop production to install sensors?
In 90% of cases, installing wireless sensors does not require stopping the equipment. Installation is carried out on a working unit in 15–20 minutes. The sensor is attached to a magnetic base or special glue, after which it immediately begins to transmit data. Stopping is only required for insertion sensors in high pressure systems or in extreme temperature areas where welding of the sleeves is required. We recommend that installation be carried out during planned process breaks to ensure personnel safety, but it is technically possible to do this on the fly.
How to distinguish a real defect from technological process interference?
This is the main task of analytics algorithms. Modern systems use contextual analysis: they compare the vibration level with the current load, rotation speed and ambient temperature. If vibration increases in proportion to the load, this is a technological feature. If vibration increases with a constant load, this is a developing defect. In addition, waveform analysis and cepstral analysis are used to distinguish periodic impacts (a sign of bearing defects) from random process noise. However, the initial verification should always be carried out by a live expert.
What is the return on investment for implementing such a system?
The payback period depends on the criticality of the equipment. For unique units, the downtime of which shuts down the entire plant, payback occurs after preventing one major accident (usually 6–12 months). For auxiliary equipment, the lead time can be 18–24 months by optimizing spare parts inventories and reducing labor costs. It is important to consider not only direct savings, but also indirect benefits: increased safety, compliance with environmental regulations (prevention of leaks) and increased residual value of assets.
Can the system be integrated with existing SCADA?
Yes, integration is possible and necessary. Most predictive analytics platforms support industry standard protocols (OPC UA, Modbus, MQTT). Data on the state of the equipment can be transmitted to the SCADA system in the form of status bits (“Normal”, “Warning”, “Alarm”) or numerical values of the vibration level. This allows process operators to see the technical condition of equipment in a single interface and make consistent decisions. Deep integration also allows you to block the startup of equipment if there are critical defects.
Conclusion: The future of service is now
Predictive analytics of plant equipment breakdowns is no longer a technology of the future. Today it is the industry standard for any business seeking operational efficiency. The transition from intuitive repair to data-driven management requires changes in culture, personnel skills and organizational structure, but the rewards for these efforts are many times greater than the costs. The equipment does not break down suddenly - it gives signals long before the disaster. The engineer's task is to learn to hear these signals.
Don't wait until the next big accident to start changing your approach. Auditing the current state of your equipment fleet and developing a roadmap for implementing a monitoring system is the first step towards reliability.Contact us todayto discuss the possibility of a pilot project at your enterprise and get an estimate of potential savings.
For a deeper dive into the topic, we recommend studying our material aboutvibration diagnostics of rotating equipmentand ISO standards for condition monitoring.